Eric Bergman-Terrell's Blog
After I employed the techniques in a previous blog post to keep this website running, I saw that the web app was automatically restarted after running for multiple days. My monitoring software did not get a response after hitting the "alive" url. I also observed steadily increasing memory utilization. It seemed that I had a memory leak on my hands.
The first thing I did was enable the website to generate heap dumps by installing the heapdump module. In order to install heapdump on my Windows 10 development machine, Microsoft Visual Studio had to be installed, as well as an older version of python.
var heapdump = require('heapdump');
var config = require('../libs/config');
var utils = require('../libs/utils');

...

function setupHeapDump(app) {
    app.get('/admin/heapdump', function(req, res) {
        heapdump.writeSnapshot(config.heapDumpFolder + Date.now() + '.heapsnapshot', utils.singleUseCallback(function(err, filename) {
            res.render('../views/admin/heapdump', { title: 'Heap Dump', heapdumpfilename: filename });
        }));
    });
}

exports.setup = function(app) {
...
    setupHeapDump(app);
};
Putting the inner function, or closure, in a call to utils.singleUseCallback, ensures that the closure doesn't cause a memory leak. I'll explain closures and utils.singleUseCallback, below.
heapdump.ejs: (I am using the EJS template engine)
<% layout('../admin_layout') -%>
<h1><%= title %></h1>

<p>
    Wrote heapdump: <%= heapdumpfilename %>
</p>
Since I didn't want to have to click through my website for hours, in order to reproduce the memory leak, I installed Apache JMeter, generated a heap dump, and ran the website, under load, for a few minutes. Then I generated a second heap dump.

Apache JMeter is a useful load testing tool
I loaded both heap dump files into WebStorm as well as the Chrome browser. WebStorm displayed more meaningful results than Chrome, but was somewhat crash-prone. Both WebStorm and Chrome showed a large number of "smalloc" objects, associated with writing log messages.
I eventually determined that using the log4js connectLogger function for HTTP request logging was causing the leak:
var log4js = require('log4js');

...

app.use(log4js.connectLogger(logger));
When I replaced the above code with the code mentioned in this blog post, the memory leak was partially fixed. I had to address memory-leaking closures in order to fix all of the memory leaks.
A closure is an inner function that can access variables and parameters in the surrounding scope. Closures tend to cause memory leaks because they can access variables in the surrounding scope, and the garbage collector cannot know when the closure will no longer access those variables. I use this method to avoid leaks caused by closures:
// http://stackoverflow.com/questions/16442201/closure-and-callback-memory-leak-in-javascript
exports.singleUseCallback = function (callback)
{
    function callbackWrapper()
    {
        try {
            return callback.apply(this, arguments);
        }
        finally {
            delete callback;
        }
    }

    return callbackWrapper;
};
singleUseCallback converts a callback into a callback that can only be used one time, preventing memory leaks. JosiahDaniels created the original code. I added the exception handling.
For example, in the following code, the function that is the third argument to connection.query is a closure. It can potentially access the queryString, connection, and values variables, as well as the id and callback parameters. Since the garbage collector cannot know when it will no longer access those values, they cannot be garbage collected. But wrapping the function in a call to utils.singleUseCallback ensures that the closure is deleted, allowing the values to be garbage collected.
exports.retrievePost = function(id, callback) {
    var queryString = 'SELECT * from blogs WHERE ID = ?';

    var connection = db.createConnection();
    connection.connect();

    connection.query(queryString, [id], utils.singleUseCallback(function (error, rows, fields) {
        connection.end();

        if (!error && (rows == null || rows.length == 0)) {
            error = "cannot retrieve blog content for id " + id;
        }

        callback(error, !error ? rows[0] : null);
    }));
};
For Windows users, Process Explorer can help identify memory leaks:
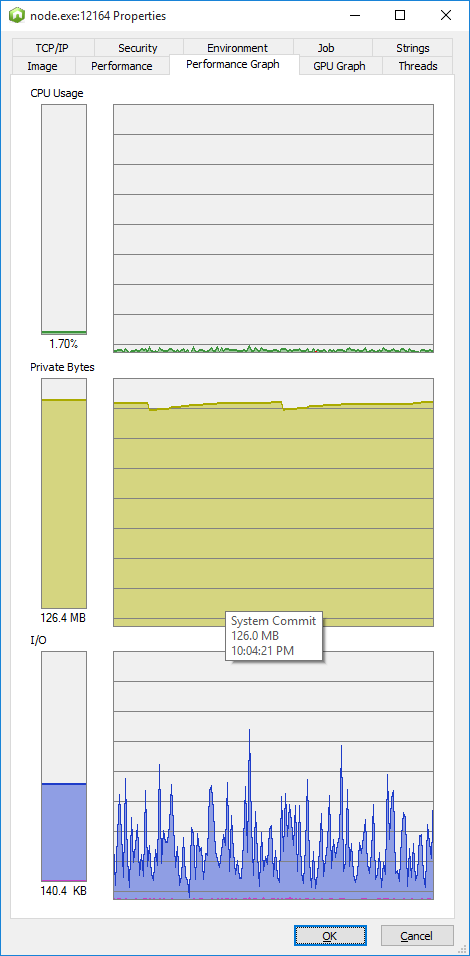

I have been guilty of the occasional leak!
Reader Comments
Comment on this Blog PostRecent Posts
| Title | Date |
| EBT Weather is now available for Windows and Linux | May 30, 2026 |
| Node.js + Express: How to Block Requests by User-Agent Headers | January 7, 2026 |
| Vault 3 is Now Available for Windows on ARM Machines! | December 13, 2025 |
| Vault 3: How to Include Outline Text in Exported Photos | October 26, 2025 |
| .NET Public-Key (Asymmetric) Cryptography Demo | July 20, 2025 |
| Raspberry Pi 3B+ Photo Frame | June 17, 2025 |
| EBTCalc (Android) Version 1.53 is now available | May 19, 2024 |