EBTCalc (Desktop)
Description
EBTCalc (Desktop) is a Reverse Polish Notation (RPN) calculator that can have custom buttons. Custom buttons are programmed in Javascript with a convenient editor. EBTCalc runs on Windows 10 and Linux. EBTCalc is open source.
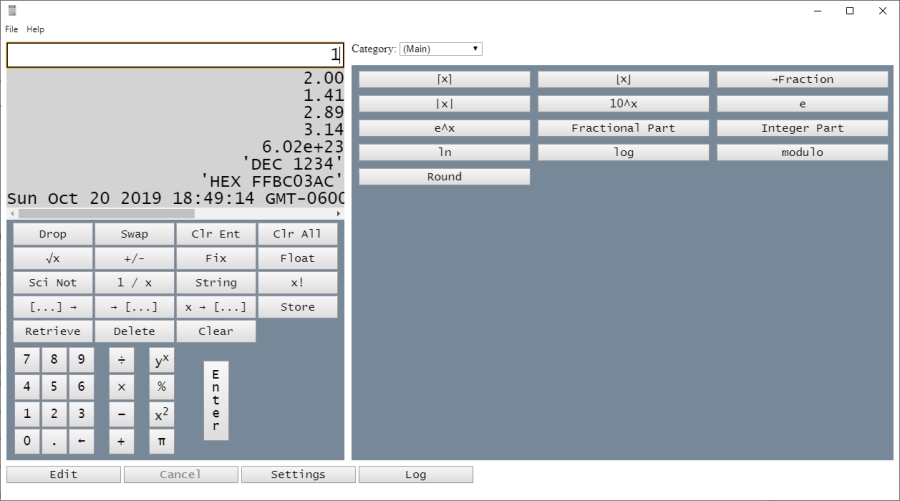
EBTCalc Main Screen
RPN Calculators
RPN calculators require numbers to be entered before the operation is performed. Operations have no priority - they are performed in the order entered. Consequently RPN calculators do not need parentheses. Since numbers must be entered before the operation to be performed, to evaluate 1 + 2:- Press the 1 button
- Press the Enter button
- Press the 2 button
- Press the + button
More Examples:
| Expression | How to Evaluate |
| 17 * (3 + 4) | 17 Enter 3 Enter 4 + * |
| 3.14 * 123.4^2 | 3.14 Enter 123.4 x^2 * |
| (3^2 * (7^2 - 8)) / 5 | 3 x^2 7 x^2 8 - * 5 / |
The Value Entry Area and the Stack
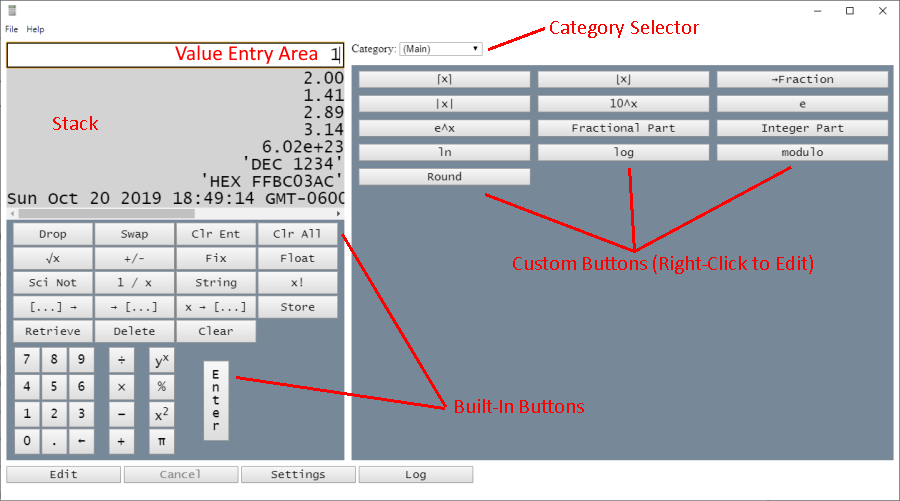
Value Entry Area, Stack, Category Selector, Built-in Buttons, Custom Buttons
As values are entered they are displayed in the Value Entry Area. Press the BS (Back Space) button to correct errors in the value you're entering. Press the Clear Ent (Clear Entry) button to clear the entire value.
Every time you press the Enter key, the value you entered is placed at the top of a list, called the Stack.
Built-in Buttons
EBTCalc includes the usual buttons that you'd expect to find on a calculator. These buttons operate on values stored in the stack. For instance, in the above illustration, pressing the + button would take the top two values from the stack (2 and 1), add them, and finally replace them with the sum (3).
Pre-Programmed Buttons
In addition to the built-in buttons, EBTCalc includes many pre-programmed buttons in various categories. For instance, in the above illustration, the Main category includes the following buttons: ⌈x⌉, ⌊x⌋, →Fraction, and so on.
Since pre-programmed buttons are implemented in Javascript, they can be removed or changed by editing the Javascript code.
Category Selector
Pre-programmed and custom buttons are arranged in categories. To display the buttons belong to a particular category, click the Category Selector (figure 2).
Adding Custom Buttons (with Methods)
Custom buttons are added by programming them in Javascript. To add a new button, click Edit. For example, to add a new custom button to compute the distance between two points, click Edit.
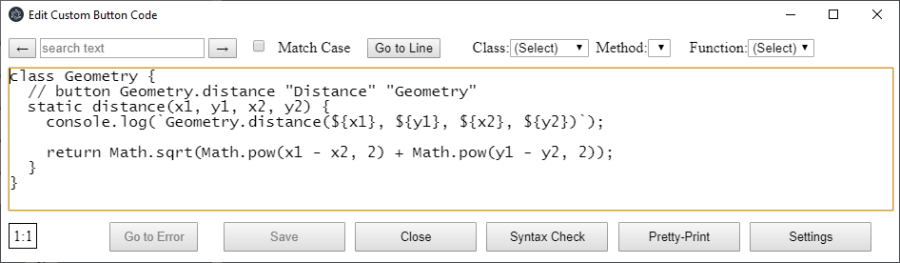
Creating a custom Button, Step 1
Add the following code. Do not enter the line numbers.
1:  class Geometry {
2:    // button Geometry.distance "Distance" "Geometry"
3:    static distance(x1, y1, x2, y2) {
4:      console.log(`Geometry.distance(${x1}, ${y1}, ${x2}, ${y2})`);
5:
6:      return Math.sqrt(Math.pow(x1 - x2, 2) + Math.pow(y1 - y2, 2));
7:    }
8:  }
Press the Save button, then press Close. Click the Category Selector and select "Geometry". You should now see the button for the distance function. Try it out:
Click 0 and click Enter
Click 1 and click Enter
Click 1, 0, 0 and click Enter
Click 1, 0, 1 and click Enter
The stack should now have the following values:
0
1
100
101
Custom Button Help Text
When you hover the cursor over any custom button, you'll see help text that shows the parameters that must be entered on the stack. For example, hover over the custom "Distance" button you just created:
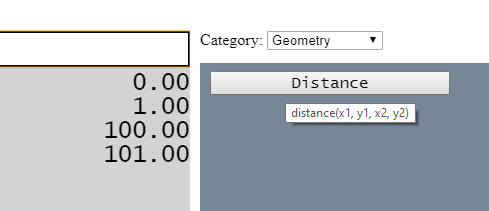
Custom Button Help Text
Click the Distance button you just created. The computed distance (141.42) will appear in the stack.
Now an explanation of the source code you entered:
In line 1 a new class named Geometry was declared. The comment in line 2 cased the custom "distance" button to be created. Such comments must be entered in the following format, exactly:
    // button {class name.method name} "{button text}" "{category text}"

    or

    // button {function name} "{button text}" "{category text}"
The distance method was declared in lines 3 to 7. Since the distance method is static, it's not necessary to have a Geometry object on the stack to call the distance method. Once 4 numbers have been entered, the distance button can be pressed to compute the Pythagorean distance between the points (x1, y1) and (x2, y2). In line 4 the arguments are logged. More about logging soon.
How Stack Values are Converted to Arguments
The arguments (x1, y2, x2, y2) in line 3 come from values the user has previously entered on the stack:
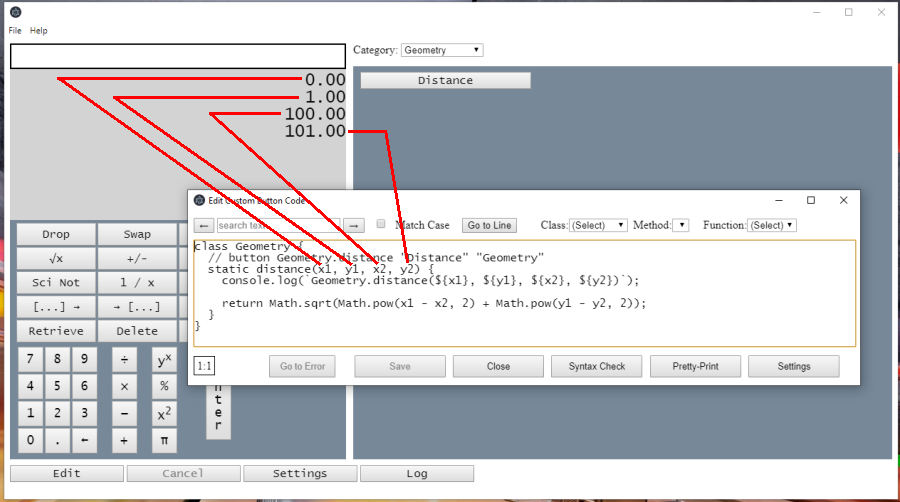
How Stack Values are Converted to Arguments
Default and Rest Arguments
You can use default and rest parameters in your methods and functions. For example:
// button defaultedArg "defaultedArg" "Functions"
function defaultedArg(x, y = 0) {
  console.log(`defaultedArg(${x}, ${y})`);

  return x + y;
}

// button restArg "restArg" "Functions"
function restArg(x, ...moreArgs) {
  console.log(`restArg(${x}, [${moreArgs}])`);

  let sum = 0;

  moreArgs.forEach(element => {
    sum = sum + element;
  });

  return x * sum;
}
With the above custom button code, when you click the "defaultArg" button, if there are two values on the stack, they will be converted into the x and y arguments. If there is only one value on the stack, it will be converted to the x argument, and the y argument will have the default value of 0.
When you click the "restArg" button, the first value on the stack will be converted to the x argument. All other values, if any, will be converted into the moreArgs argument, which is an array.
Logging
Click the Log button to see the log messages written by the distance function:
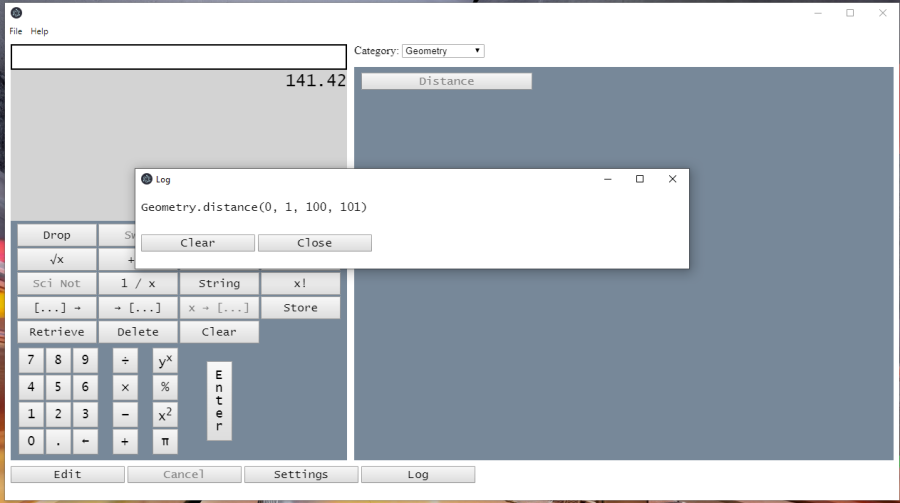
Log Messages
Adding Custom Buttons (with Functions)
In the previous example, you created a class (Geometry) and a method (distance), callable by clicking a custom button. In this example, you'll do the same thing, with a function.
Click Edit to return to editing custom button code. Add the following code. Do not enter the line numbers:
10:  // button answer "answer" "Functions"
11:  function answer() { return 42; }
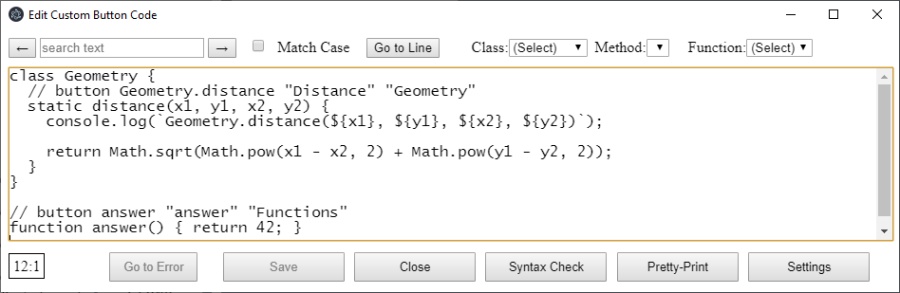
Creating a Custom Button Using a Function
Click Save, then click Close
Test your new button by clicking the Category Selector and selecting "Functions". Click the "answer" custom button. Since this function has no arguments, no values need to be entered on the stack.
Right Clicking Custom Buttons
When you right click a custom button, you'll go to that button's code in the edit window. If the button is disabled, you'll have to click the "Edit" button.
Cancel Long-Running Custom Button Code
If the code for a custom button takes too long to run, click Cancel.
Stack Context Menus
When you right-click the stack, you'll be able to display the stack in a larger window, or copy a selected item or the entire stack.
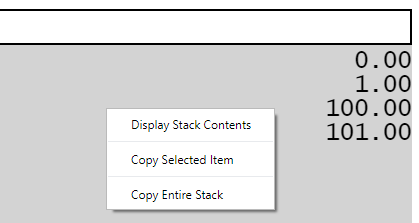
Stack Menu
Click Display Stack Contents and you'll see the logging messages created when the Custom.Fibonacci method was run. By default, only the most recent 100 log messages are retained. This threshold can be increased by editing the Javascript code, but increasing the number of lines will tend to slow down the app since it permanently stores the logging statements.
Another Custom Button Example (Computing Pi to an Absurdly High Precision)
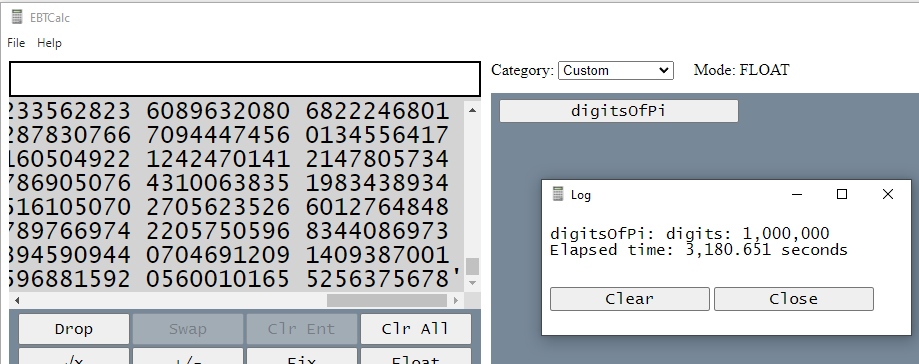
One Million Digits of Pi
Click Edit and enter the following code, which is mostly based on Andrew Jennings' code:
class Pi {
  static format(digits, spaceFreq, newLineFreq) {
    const wholeNumber = "3.\n";

    digits = digits.substring(1);

    let result = "";

    for (let i = 0; i < digits.length; i++) {
      result += digits[i];

      const ordinalPos = i + 1;

      if (ordinalPos % newLineFreq === 0) {
        result += "\n";
      } else if (ordinalPos % spaceFreq === 0) {
        result += " ";
      }
    }

    return wholeNumber + result.trim();
  }

  // http://ajennings.net/blog/a-million-digits-of-pi-in-9-lines-of-javascript.html
  // https://math.tools/numbers/pi/1000000

  // button Pi.digitsOfPi "digitsOfPi" "Custom"
  static digitsOfPi(digits) {
    if (!Number.isInteger(digits) || digits < 1) {
      throw "Error: Argument must be a whole number ≥ 1";
    }

    console.log(`digitsOfPi: digits: ${Number(digits).toLocaleString()}`);

    const startTime = new Date();

    let i = 1n;
    let x = 3n * 10n ** BigInt(digits + 20);
    let pi = x;

    while (x > 0) {
      x = (x * i) / ((i + 1n) * 4n);
      pi += x / (i + 2n);
      i += 2n;
    }

    const result = Pi.format((pi / 10n ** 20n).toString(), 10, 100);

    const elapsedSeconds = (new Date() - startTime) / 1000;

    console.log(
      `Elapsed time: ${Number(elapsedSeconds).toLocaleString()} seconds\n`
    );

    return result;
  }
}
Finally, click the Log button, enter the number of digits to calculate, specify the "Custom" category, and click the "digitsOfPi" custom button.
When strings are returned by a custom button function, if they contain newline characters ('\n'), there will be visible line breaks in the stack display. The format function (above) embeds newlines in the string it returns to display the result in multiple lines.
Note: You can use the built-in Javascript BigInt type in custom code, but be sure to convert BigInt objects to strings before returning them from a function. EBTCalc currently cannot serialize/deserialize BigInt objects to move them between custom code and the stack.
Graphing
You can graph any function's values with EBTCalc.
For example, click the Edit button and add the following code:
function fibonacci(n) {
  if (n === 0) {
    return 0;
  } else if (n === 1) {
    return 1;
  } else {
    return fibonacci(n - 2) + fibonacci(n - 1);
  }
}

// button graph "Graph" "Graph"
function graph() {
  return ___Graph.render(
    fibonacci,
    0,
    30,
    1,
    "f(x)",
    "Fibonacci Numbers",
    "X",
    "Y",
    "linear",
    "linear"
  );
}
Click the "Save" and "Close" buttons. Then select the "Graph" category and the graph will be drawn:
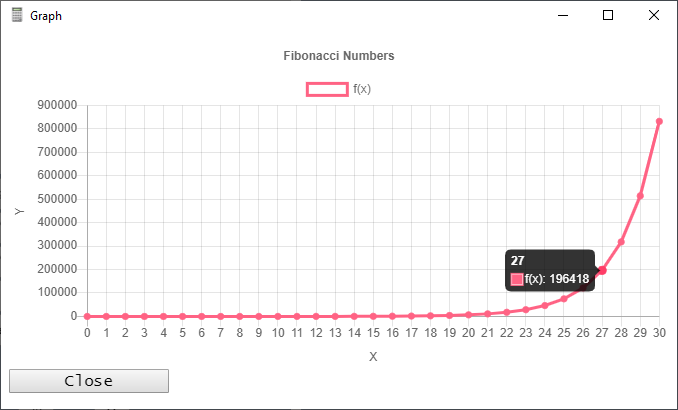
Graph
___Graph.render arguments:
| Argument | Description | Default Value |
| function | function to graph. This function must return a numerical result and must have a single parameter. | n/a |
| minX | Minimum x-axis value. | n/a |
| maxX | Maximum x-axis value. | n/a |
| interval | Distance between two consecutive points, on the x-axis. | n/a |
| dataSetName | Title of dataset being graphed | 'f(x)' |
| title | Graph Heading | 'Graph' |
| xAxisLabel | x-Axis Title | 'X' |
| yAxisLabel | y-Axis Title | 'Y' |
| xAxisType | x-Axis Type. Acceptable values: 'linear', 'logarithmic'. | 'linear' |
| yAxisType | y-Axis Type. Acceptable values: 'linear', 'logarithmic'. | 'linear' |
EBTCalc uses Chart.js. You can generate a graph using the simplified ___Graph.render function (above), or you can use the full power of Chart.js (see function fullControlGraph(), below). See Chart.js for details.
// button fullControlGraph "Graph (Full Control)" "Graph"
function fullControlGraph() {
  const graphData = {
    type: "bar",
    data: {
      labels: ["Red", "Blue", "Yellow", "Green", "Purple", "Orange"],
      datasets: [
        {
          label: "# of Votes",
          data: [12, 19, 3, 5, 2, 3],
          backgroundColor: [
            "rgba(255, 99, 132, 0.2)",
            "rgba(54, 162, 235, 0.2)",
            "rgba(255, 206, 86, 0.2)",
            "rgba(75, 192, 192, 0.2)",
            "rgba(153, 102, 255, 0.2)",
            "rgba(255, 159, 64, 0.2)"
          ],
          borderColor: [
            "rgba(255, 99, 132, 1)",
            "rgba(54, 162, 235, 1)",
            "rgba(255, 206, 86, 1)",
            "rgba(75, 192, 192, 1)",
            "rgba(153, 102, 255, 1)",
            "rgba(255, 159, 64, 1)"
          ],
          borderWidth: 1
        }
      ]
    },
    options: {
      scales: {
        yAxes: [
          {
            ticks: {
              beginAtZero: true
            }
          }
        ]
      }
    }
  };

  return new ___Graph(graphData.type, graphData.data, graphData.options);
}
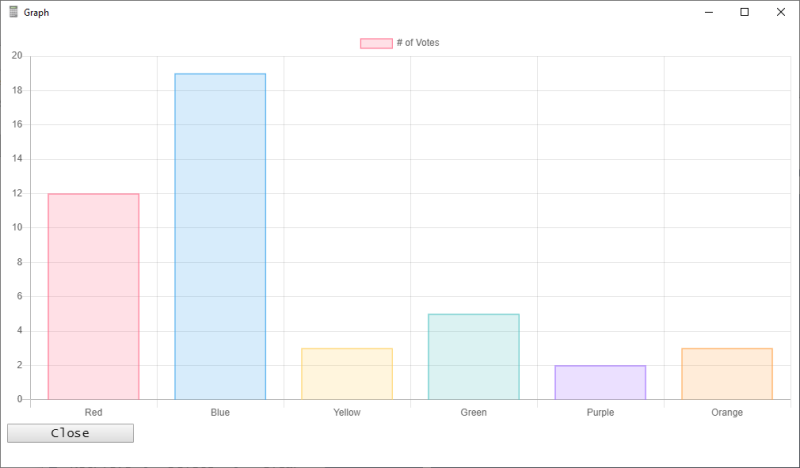
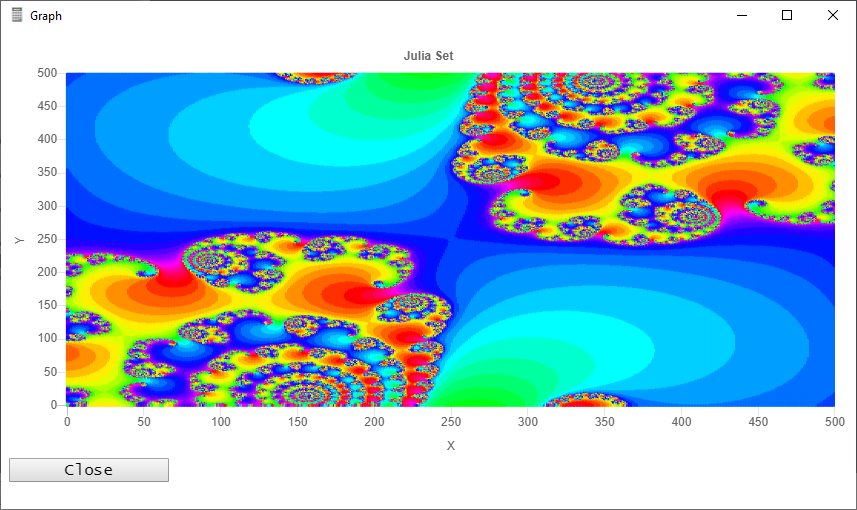
Graphing with Access to all Chart.js Features
It addition to graphs of function values, it's possible to draw arbitrary graphics. For example, the Julia set:
class JuliaSet {
  // Based on: http://rosettacode.org/wiki/Julia_set#JavaScript

  // button JuliaSet.render "Julia Set" "Graph"
  static render() {
    var maxIterations = 450,
      minX = -0.5,
      maxX = 0.5,
      minY = -0.5,
      maxY = 0.5,
      wid,
      hei,
      ctx,
      jsX = 0.285,
      jsY = 0.01;

    function remap(x, t1, t2, s1, s2) {
      const f = (x - t1) / (t2 - t1),
        g = f * (s2 - s1) + s1;

      return g;
    }

    function getColor(c) {
      var r,
        g,
        b,
        p = c / 32,
        l = ~~(p * 6),
        o = p * 6 - l,
        q = 1 - o;

      switch (l % 6) {
        case 0:
          r = 1;
          g = o;
          b = 0;
          break;
        case 1:
          r = q;
          g = 1;
          b = 0;
          break;
        case 2:
          r = 0;
          g = 1;
          b = o;
          break;
        case 3:
          r = 0;
          g = q;
          b = 1;
          break;
        case 4:
          r = o;
          g = 0;
          b = 1;
          break;
        case 5:
          r = 1;
          g = 0;
          b = q;
          break;
      }

      return `rgba(${r * 255},${g * 255},${b * 255},1.0)`;
    }

    function drawFractal() {
      const points = [];

      var a, as, za, b, bs, zb, cnt, clr;

      for (var j = 0; j < hei; j++) {
        for (var i = 0; i < wid; i++) {
          a = remap(i, 0, wid, minX, maxX);
          b = remap(j, 0, hei, minY, maxY);

          cnt = 0;

          while (++cnt < maxIterations) {
            za = a * a;
            zb = b * b;

            if (za + zb > 4) {
              break;
            }

            as = za - zb;
            bs = 2 * a * b;
            a = as + jsX;
            b = bs + jsY;
          }

          if (cnt < maxIterations) {
            points.push({ x: j, y: i, color: getColor(cnt) });
          }
        }
      }

      return points;
    }

    function init() {
      wid = hei = 500;

      return drawFractal();
    }

    const graphData = {
      type: "bubble",
      data: {
        datasets: []
      },
      options: {
        legend: {
          display: false
        },
        title: {
          display: true,
          text: "Julia Set"
        },
        scales: {
          yAxes: [
            {
              scaleLabel: {
                display: true,
                labelString: "Y"
              }
            }
          ],
          xAxes: [
            {
              scaleLabel: {
                display: true,
                labelString: "X"
              }
            }
          ]
        }
      }
    };

    const points = init();

    points.forEach(point => {
      const dataset = {
        pointStyle: "rect",
        label: "",
        backgroundColor: point.color,
        borderColor: point.color,
        data: [
          {
            x: point.x,
            y: point.y,
            r: 1
          }
        ]
      };

      graphData.data.datasets.push(dataset);
    });

    // console.log(`${JSON.stringify(graphData)}`);

    return new ___Graph(graphData.type, graphData.data, graphData.options);
  }
}
Defensive Programming
Factorials can only be competed for values ≥ 0. If you enter a negative value, EBTCalc displays an error message. Try it for yourself: Enter a -2 (click 2, then click "+/-"). Then click "x!" and you'll see a red error message on the bottom right:
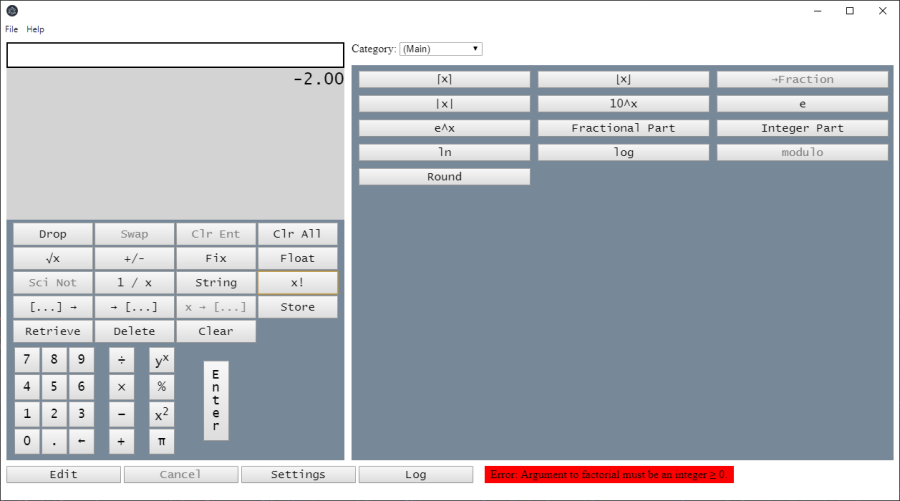
Error Message
You can use the same technique in your custom code. Just add a throw statement if any function or method argument is invalid (line 5):
1:  _factorial(n) {
2:      n = new BigNumber(n).toNumber();
3:
4:      if (!Number.isInteger(n) || n < 0) {
5:          throw 'Error: Argument to factorial must be an integer ≥ 0.';
6:      }
7:
8:      return (n === 0 || n === 1) ? 1 : n * this._factorial(n - 1);
9:  }
Storing and Retrieving Variables
Variables can be stored indefinitely and retrieved. Select the Memory category with the Category Selector. To store the top stack value, click the Store button. Click Retrieve to retrieve a previously stored value. Click Delete to delete a specific variable. Click Clear to delete all variables.
Stack Manipulation
Custom button functions implicitly pop items off the stack for each custom button function argument. And if the function returns a result, that result is pushed to the stack. Additionally, your custom button functions can manipulate the stack as follows:
- Use a rest parameter in the function to access all stack values
- Call ___Stack.push to push stack values
For example, the pre-defined "Roll ↑" and "Roll ↓" button functions are implemented as follows:
class StackManipulation {
    // button StackManipulation.rollUp "Roll ↑" "Stack"
    static rollUp(...stack) {
        if (stack.length) {
            for (let i = 1; i < stack.length; i++) {
                ___Stack.push(stack[i]);
            }

            ___Stack.push(stack[0]);
        }
    }

    // button StackManipulation.rollDown "Roll ↓" "Stack"
    static rollDown(...stack) {
        if (stack.length) {
            ___Stack.push(stack[stack.length - 1]);

            for (let i = 0; i < stack.length - 1; i++) {
                ___Stack.push(stack[i]);
            }
        }
    }
}
You can call ___Stack.push in your own custom button functions.
Settings
Click the "Settings" button to specify the decimal point, thousands separator, and tab width
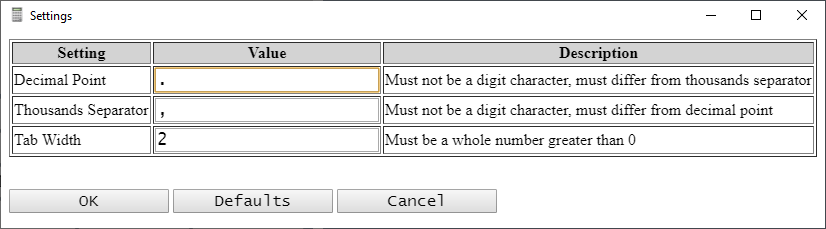
Settings
Downloading
Download EBTCalc (Desktop).
Thanks!
Thank you for your interest in EBTCalc. I hope you find EBTCalc to be a useful and enjoyable tool. I welcome any and all feedback. Click the Help / Email Feedback menu item to send me feedback.

Eric Bergman-Terrell, Greta, & Rudy